The open and composable observability and data visualization platform.
Visualize metrics, logs, and traces from multiple sources like Prometheus, Loki, Elasticsearch, InfluxDB, Postgres and many more.
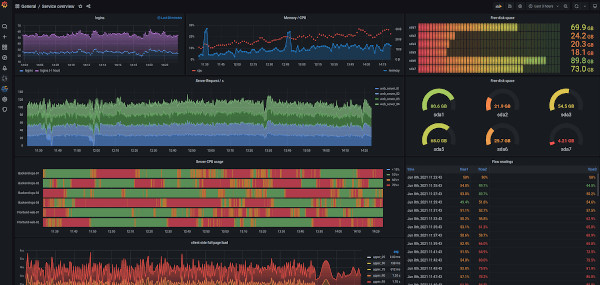
Grafana allows you to query, visualize, alert on and understand your metrics no matter where they are stored. Create, explore, and share dashboards with your team and foster a data-driven culture:
- Visualizations: Fast and flexible client side graphs with a multitude of options. Panel plugins offer many different ways to visualize metrics and logs.
- Dynamic Dashboards: Create dynamic & reusable dashboards with template variables that appear as dropdowns at the top of the dashboard.
- Explore Metrics: Explore your data through ad-hoc queries and dynamic drilldown. Split view and compare different time ranges, queries and data sources side by side.
- Explore Logs: Experience the magic of switching from metrics to logs with preserved label filters. Quickly search through all your logs or streaming them live.
- Alerting: Visually define alert rules for your most important metrics. Grafana will continuously evaluate and send notifications to systems like Slack, PagerDuty, VictorOps, OpsGenie.
- Mixed Data Sources: Mix different data sources in the same graph! You can specify a data source on a per-query basis. This works for even custom datasources.
TIP ME !
Your gratitude and finance will help me to continue integration of this QPKG and maintain up to date versions.
Your gratitude and finance will help me to continue integration of this QPKG and maintain up to date versions.

Last update: 4 June 2026


Reviews
There are no reviews yet.